
Understanding the structural mechanics of daily drawdown vs maximum drawdown is the single most important factor determining whether an institutional evaluation trader survives or gets liquidated. Most retail traders treat prop firm drawdown rules as passive speed bumps, but risk desks design them as aggressive, mathematically unforgiving boundary conditions. Failing to grasp how these two limits intersect under live market conditions accounts for more than 90% of all blown evaluations.
In proprietary trading, capital protection overrides raw profitability. A trader capable of producing 15% monthly returns is worthless to an institutional firm if their risk profile triggers a contract breach during a routine market pullback. To secure and keep a funded account, you must manage your downside risk with the same statistical precision used by the desk that issues your capital allocation.
1. The Core Architecture: Daily vs. Maximum Drawdown
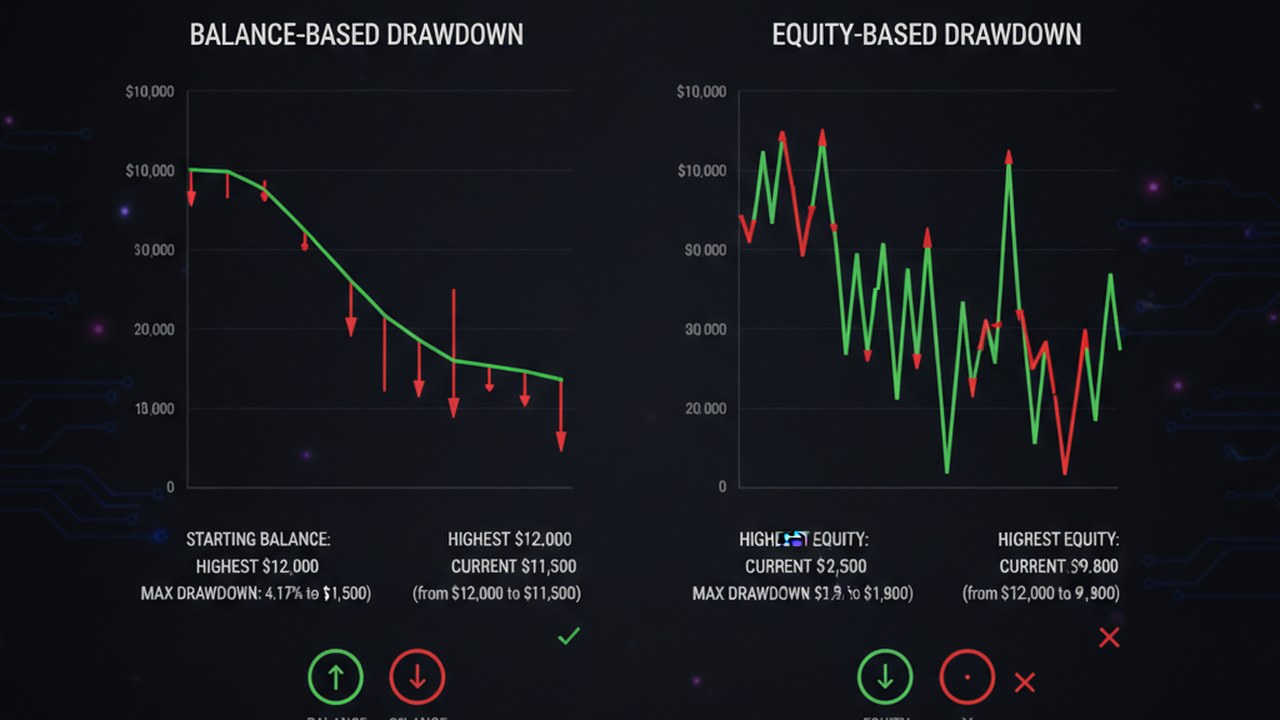
At its most fundamental level, the difference between daily drawdown and maximum drawdown comes down to time horizon and risk mandate.
- Daily Drawdown acts as an intraday circuit breaker. It limits the total capital destruction you can inflict on an account within a single trading day (typically pegged to the broker’s server reset time). Its institutional purpose is to protect the firm against trader tilt, revenge trading, sudden liquidity flash crashes, and black swan events.
- Maximum Drawdown acts as your total account solvency floor. It sets the absolute lifetime boundary of your loss allowance relative to your starting balance or highest balance achieved. If your account equity or balance breaches this floor at any time, your contract terminates immediately.
While maximum drawdown sets your total room to maneuver, daily drawdown dictates your daily survival. You can be miles away from your lifetime maximum drawdown limit, but if you drop a single dollar past your daily floor due to spread expansion or an unchecked runner, your account is revoked instantly.
2. Deconstructing Daily Drawdown: Mechanics, Resets, and Pitfalls
The daily drawdown metric is widely misunderstood because prop firms do not calculate it uniformly. The exact wording in your prop firm risk management policy dictates whether you have breathing room or are trading on an invisible razor’s edge.
Balance-Based vs. Equity-Based Daily Drawdown
The operational difference between balance-based and equity-based calculations is where thousands of evaluations are lost every week.
1. Balance-Based Daily Drawdown
This is the cleaner, more trader-friendly calculation. The daily floor is calculated solely off the account balance at the start of the trading day (usually 17:00 EST or 00:00 Broker Server Time).
📐 Balance-Based Daily Loss Limit Formula:
Daily Floor = Balance at Server Reset - (Initial Challenge Capital × Daily DD %)
On a $100,000 account with a 5% limit:
- Balance at 00:00 server time: $100,000
- Daily Loss Limit: $5,000
- Daily Floor: $95,000
Under this model, floating intraday profits that evaporate do not penalize your daily floor for that day, provided your equity does not dip below $95,000.
2. Equity-Based Daily Drawdown (The Floating Equity Trap)
In this institutional model, the firm calculates your daily drawdown off the higher of your balance or equity at the exact moment of the server reset. Some aggressive firms even recalibrate your daily loss floor dynamically throughout the day as your floating equity reaches new intraday highs.
📐 Equity-Based Daily Loss Limit Formula (At Reset):
Starting Metric = Higher of (Account Balance, Account Equity at 00:00)Daily Floor = Starting Metric - (Initial Challenge Capital × Daily DD %)
The Rollover Spread Shock and Midnight Resets
Broker server rollover (typically 17:00 New York / 00:00 Broker Time) introduces a dangerous structural vulnerability. At rollover:
- Liquidity evaporates: Interbank liquidity providers pull liquidity pools to settle trades, causing spreads on major pairs to widen from 0.2 pips to 5.0, 10.0, or even 20.0 pips for several minutes.
- Financing charges apply: Daily swaps (financing fees) are credited or debited to your open positions, with triple swaps hitting on Wednesdays.
- The daily floor recalculates: If you are holding an open position running in substantial floating profit into rollover, that equity becomes the new baseline benchmark for your daily floor.
Practical Failure Case Study:
You hold an intraday long position on EUR/USD on a $100,000 account with a 5% ($5,000) daily limit.
- 23:55 Server Time: Your account balance is $100,000. Your floating open profit is +$4,000. Total equity is $104,000.
- 00:00 Server Time (Reset): The firm utilizes equity-based daily drawdown. The new daily benchmark locks in at $104,000.
- Your new Daily Loss Floor for the day is:
$104,000 - $5,000 = $99,000. - 00:03 Server Time: Asian session opens quietly, but EUR/USD retraces half of the prior day’s trend. Your floating profit drops from +$4,000 back to -$1,000.
- Current Equity: $99,000.
- Spread Widening Spike: Spreads widen temporarily by 2.5 pips. Your equity momentarily prints at $98,750.
- Outcome: Account Breached. Even though your total closed balance was never below $100,000, you lost more than $5,000 of equity relative to the midnight starting snapshot.
To safeguard your account from this exact scenario, use Proppass, an automated drawdown guardian and equity stop tool built specifically for cTrader. Proppass sits directly on your platform, monitoring your equity in real-time, executing automated emergency position flattenings, and locking your terminal before broker-level liquidations trigger.
3. Deconstructing Maximum Drawdown: Static vs. Trailing
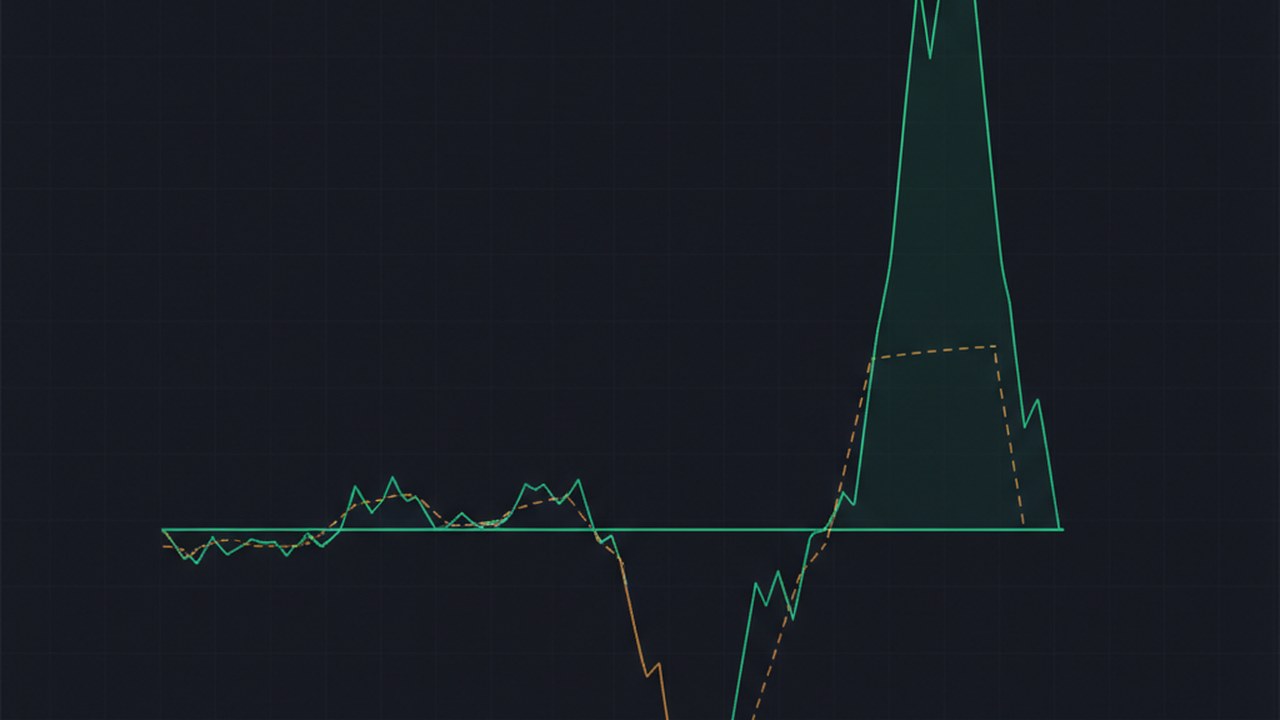
Maximum drawdown dictates the ultimate capital boundary you can forfeit across the lifetime of the evaluation or funded account. Prop firms employ two primary mechanics for calculating this ceiling: Static (Absolute) Drawdown and Trailing Drawdown.
1. Static (Absolute) Maximum Drawdown
Static drawdown is the cleanest model in proprietary trading. The maximum drawdown floor is anchored permanently to your initial challenge starting balance.
📐 Static Drawdown Floor Formula:
Static Max DD Floor = Initial Capital - (Initial Capital × Max DD %)
On a $100,000 account with a 10% static maximum drawdown:
Static Floor = $100,000 - $10,000 = $90,000
It does not matter whether your account balance grows to $105,000, $115,000, or $130,000. Your loss floor remains anchored at $90,000.
When your account balance reaches $110,000, your effective risk buffer grows from $10,000 to $20,000. This structure allows institutional trend-followers and swing traders to hold positions through normal market pullbacks without fearing an upward-ratcheting liquidation point.
2. Trailing Drawdown (High Water Mark Mechanics)
Trailing drawdown ratchets the loss floor upward as your account achieves new high-water marks (HWM). It is heavily utilized by futures prop firms and aggressive FX evaluation models to restrict effective leverage.
Trailing drawdown comes in two distinct execution models: End-of-Day (EOD) Trailing and Intraday Tick-by-Tick Trailing.
A. End-of-Day (EOD) Trailing
The firm updates your maximum drawdown floor only when the trading day concludes, using your closed balance or peak daily equity at the settlement reset.
📐 EOD Trailing Drawdown Floor Formula:
New High Water Mark = Max(Previous HWM, Daily Closing Metric)Trailing Floor = New High Water Mark - (Initial Capital × Max DD %)
If you make $3,000 on Day 1, closing at $103,000, your new maximum loss floor moves from $90,000 up to $93,000. If you lose $1,000 on Day 2, closing at $102,000, your floor does not move back down; it remains fixed at $93,000.
B. Intraday Tick-by-Tick Trailing (The Unforgiving Desk Model)
This is the most punitive risk model in the prop firm industry. The loss floor trails your open floating equity in real-time, tick-by-tick.
If you enter a trade on a $100,000 account with a 10% ($10,000) trailing drawdown:
- Starting Floor: $90,000.
- Your trade moves into +$6,000 unrealized profit. Your peak floating equity hits $106,000.
- Instantly, your maximum drawdown floor trails upward to
$106,000 - $10,000 = $96,000. - Market structure shifts, and your trade retraces, hitting your trailing stop-loss at breakeven ($100,000).
- Your new reality: Your account balance is $100,000, but your maximum drawdown floor is now locked at $96,000.
- Result: You have burned 60% of your initial $10,000 maximum drawdown allowance without taking a single closed loss.
The High Water Mark Lock Point
Most reputable prop firms with trailing rules freeze the trailing floor once it reaches your initial starting balance:
📐 High Water Mark Lock Condition:
If Trailing Floor >= Starting Capital, Trailing Floor = Starting Capital
Once your floor locks at your starting capital ($100,000), all further profits become true risk capital that you can draw down against without moving the floor higher.
4. The 4 Major Prop Firm Drawdown Archetypes
Proprietary trading firms assemble these rules into specific combinations. Before risking capital on an evaluation, identify which institutional archetype you are trading under:
| Archetype | Daily DD Engine | Max DD Engine | Execution Severity | Best Suited For |
|---|---|---|---|---|
| 1. Classic Institutional | Balance-based (Reset at 00:00) | Static (Anchored to Start Balance) | Low | Swing Traders, Multi-Day Trend Followers |
| 2. Dynamic FX Standard | Equity-based (Reset at 00:00) | Static (Anchored to Start Balance) | Moderate | Intraday Scalpers, Day Traders |
| 3. Futures Trailing EOD | Daily Loss Limit (Hard stop) | EOD High Water Mark Trailing | High | Momentum Day Traders, Breakout Traders |
| 4. Apex Tick-by-Tick | None or Fixed Intraday | Tick-by-Tick Open Equity Trailing | Extreme | Fast Scalpers, Strict Micro-Target Traders |
How Archetype 4 Destroys Sizing Math
Under Archetype 4, wider profit targets work mathematically against you. If you target 3R on a trade with open swings, any intra-trade consolidation trails your drawdown floor up. If the market forms a liquidity wick before continuing to your target, the wick alone can hit your ratcheted floor.
When trading under tick-based trailing constraints, you must trade with high-frequency micro targets, or use tight execution systems that take profits quickly before the trailing floor strangles your working capital.
5. Mathematical Stress Tests: How Drawdowns Kill Accounts
To survive institutional prop evaluations, look beyond percentages and calculate how your available risk capital changes across real trade scenarios.
Scenario 1: The Asymmetric Recovery Trap
Drawdown recovery is mathematically asymmetric. The deeper your account drops into its drawdown allowance, the higher the percentage return required to recover, and the smaller your allowable position size becomes.
When you hit a 5% account drawdown (-$5,000) on a $100,000 account with a 10% maximum limit:
- You have not lost 5% of your trading room; you have consumed 50% of your maximum drawdown capacity.
- Your remaining maximum risk cushion is now only $5,000.
- If you maintain your baseline position sizing (e.g., risking $1,000 per trade), you are now risking 20% of your remaining operational capital per trade instead of the initial 10%.
- A short 5-trade losing streak will breach your contract.
Scenario 2: The Double Violation (Daily vs. Max Conflict)
Consider an account with:
- Starting Balance: $100,000
- Daily Drawdown Limit: 5% ($5,000)
- Maximum Drawdown Limit: 10% ($10,000)
Suppose you have experienced three consecutive losing days, taking your balance down to $92,000.
- Your distance to Maximum Drawdown is:
$92,000 - $90,000 = $2,000. - Your calculated Daily Drawdown for today is:
$92,000 × 5% = $4,600(or $5,000 based on starting balance).
Here lies the dangerous cognitive error: Traders assume they have $4,600 to risk today.
They do not. The global maximum drawdown limit overrides the daily limit. If you lose $2,001 today, your account is terminated for breaching the maximum drawdown floor, even though you used less than half of your daily drawdown allowance.
6. Sizing Formulas: Engineering an Institutional Risk Architecture
Institutional risk managers do not size positions based on total account balance. They size positions exclusively based on the distance to the nearest liquidation boundary.
The Maximum Tolerable Loss (MTL) Formula
To calculate the absolute maximum dollar risk permitted on any single trade execution, apply this formula:
📐 Maximum Tolerable Loss (MTL) Formula:
Effective Daily Buffer = Current Equity - Daily Loss FloorEffective Max Buffer = Current Equity - Maximum Loss FloorActive Capital Cushion = Min(Effective Daily Buffer, Effective Max Buffer)MTL Per Trade = Active Capital Cushion × Risk Allocation Factor (RAF)
The Risk Allocation Factor (RAF) should never exceed 0.20 (20%) of your remaining cushion during normal conditions, and 0.10 (10%) when in an active drawdown phase.
PRACTICAL EXAMPLE:
Account Balance: $100,000
Current Equity: $96,000
Daily Loss Floor: $93,000  -> Buffer = $3,000
Max Loss Floor: $90,000    -> Buffer = $6,000
Active Capital Cushion: Min($3,000, $6,000) = $3,000

Conservative MTL (RAF = 0.10): $3,000 × 0.10 = $300 max risk on next position
Moderate MTL     (RAF = 0.20): $3,000 × 0.20 = $600 max risk on next position
If you calculate lot size using standard retail balance percentages ($96,000 × 1% = $960), you are actually exposing 32% of your entire remaining daily buffer ($960 / $3,000) on a single idea. Three consecutive losses, combined with standard execution slippage, will trigger account liquidation.
7. The Institutional Prop Trader’s Execution Stack
Managing multi-layer drawdown limits manually while executing complex strategies across volatile markets introduces severe human error. One delayed stop execution or moment of emotional hesitation can breach an evaluation account. Professional prop traders rely on a dedicated execution architecture:
1. In-Flight Execution Protection: Proppass
Never rely on mental stop-losses or broker-side pending orders alone during high-impact news releases. When tier-1 data (NFP, CPI, Rate Decisions) prints, spreads widen and orders can slip straight past standard stops.
Integrating Proppass into cTrader provides an automated equity guardian. It runs locally on your engine, tracking your exact tick-level equity against your daily and maximum drawdown parameters. If your account equity nears your personal danger threshold, Proppass instantly closes open tickets, cancels working limit orders, and locks terminal execution. This prevents the emotional death spiral of revenge trading.
2. Post-Trade Forensic Auditing: Anyted
When traders hit drawdown limits, they rarely identify the true underlying operational issue. They blame “bad market conditions” instead of recognizing execution leaks like:
- Drifting stop-losses wider during drawdown states.
- Trade sizing asymmetry (trading micro lots on winners and full size on losers).
- Trading during toxic rollover spreads.
Using Anyted, you can automatically journal every cTrader execution to audit execution efficiency. Anyted isolates drawdown clustering—pinpointing the exact hours, instruments, and hold times that burn through your daily loss allowance. This provides the forensic clarity needed to tighten your trading playbook.
3. Backtesting Strategy Fragility: Simark
Before paying evaluation fees to a prop firm, you need to prove your strategy can survive strict drawdown limits under real market microstructure conditions. Standard bar-magnifier backtesting on historical candles hides the intraday equity swings that breach trailing and daily limits.
With Simark, you can replay historical tick-by-tick data to simulate your edge against actual spread widening, institutional liquidity voids, and slippage. Simark reveals whether your system would have breached a 5% balance-based or equity-based daily limit during market events like the Swiss Franc de-pegging, the 2020 market crash, or recent central bank rate shocks.
8. Step-by-Step Risk Protocol: From Challenge to Payout
To transition from paying evaluation fees to receiving regular payouts, implement this institutional four-stage risk ladder:
EVALUATION RISK LADDER
===========================================================================
STAGE 1: EVALUATION (Target: 8-10%)
- Risk Per Trade: 0.50% of Starting Balance ($500)
- Max Trades Per Day: 2
- Daily Hard Stop: 1.5% ($1,500)
---------------------------------------------------------------------------
STAGE 2: FUNDED BUFFER BUILDING (Balance: $100k -> $103k)
- Risk Per Trade: 0.25% ($250)
- Goal: Secure $3,000 buffer to insulate the base capital
- Zero overnight holds on news days
---------------------------------------------------------------------------
STAGE 3: HARVESTING PHASE (Balance: > $103k)
- Risk Per Trade: 0.50% - 0.75% of profits accumulated
- Daily Loss Limit: Hard locked at 2% of profits
- Payout requests submitted at regular cycles
===========================================================================
The “Rule of Halves” Drawdown Reduction Ladder
If you hit an adverse run, never maintain static risk sizing. Implement an automated risk-reduction ladder:
- Normal Operations (0% to -2% DD): Risk 0.50% per trade idea. Maximum daily exposure: 1.5%.
- Caution State (-2% to -4% DD): Cut risk in half. Risk 0.25% per trade idea. Maximum daily exposure: 0.75%.
- Defense State (-4% to -7% DD): Cut risk in half again. Risk 0.125% per trade idea. Maximum daily exposure: 0.375%. Focus entirely on high-conviction A+ setups.
- Lockout Phase (-8% or worse): Halt all manual executions. Step away from the platform for 48 hours. Run your trading data through Anyted to identify strategy drift or execution leaks before taking another position.
By stepping your position sizing down as the account approaches its maximum drawdown floor, you make it mathematically difficult to breach your account. Recovering from a 1% deficit using 0.25% risk requires only four solid 1:1 trades, preserving your funded capital to trade another day.
Prop Firm Drawdown Rules: Frequently Asked Questions
1. Does daily drawdown reset based on my local time or broker time?
Daily drawdown almost always resets according to the broker’s server time, which typically aligns with 17:00 New York Time (EST) or 00:00 Broker Server Time (usually GMT+2 or GMT+3 to match the 5-day daily candle structure). Never assume the reset occurs at midnight in your local timezone. Always check the broker server clock inside your cTrader or MT5 terminal. A trade placed at 23:59 server time belongs to that trading day’s risk calculation; a trade placed two minutes later at 00:01 belongs to the next day’s risk allocation.
2. What happens to my daily drawdown if I leave a winning trade open overnight?
If your firm utilizes an equity-based daily drawdown rule, holding an open trade with unrealized profits through the midnight server reset moves your daily loss floor higher. The firm records your higher equity figure at reset time as the new baseline benchmark. If that trade subsequently reverses back to breakeven during the next session, that drawdown from the peak will count against your new day’s loss limit. This can breach your account even if the trade remains net profitable overall. Under a balance-based model, your daily floor only updates based on closed balance, protecting you from this risk.
3. Why do prop firms use trailing drawdown instead of static drawdown?
Firms use trailing drawdown—particularly intraday tick-by-tick trailing—because it drastically tilts the probability of long-term account survival in the firm’s favor. Trailing drawdown prevents a trader from building a deep profit cushion that can absorb future losing streaks. By continually raising the loss floor behind positive trades, the firm restricts its risk exposure while capping the trader’s effective operational buffer. It requires traders to maintain exceptionally high win rates and tightly controlled trade management.
4. If my stop-loss is set inside the daily limit, can I still fail the account?
Yes. A pre-set stop-loss order does not guarantee execution at that exact price. During high-impact news releases, major economic reports, or the illiquid market rollover window, prices can gap over pending orders. Your order will then execute at the next best available market price (negative slippage). If an unexpected gap causes your trade to exit even a fraction of a pip beyond your daily drawdown limit, the prop firm’s risk engine will log an automatic contract violation.
5. What is the difference between relative drawdown and trailing drawdown?
While terms vary between firms, trailing drawdown updates dynamically based on the account’s historical high-water mark, staying fixed at its highest level even when your balance drops. Relative drawdown is often calculated as a percentage drop relative to the maximum equity achieved, fluctuating dynamically in proportion to current balance metrics. In retail prop firms, “relative drawdown” is frequently used as marketing shorthand for a high-water mark trailing drawdown. Always verify the specific contractual language in your firm’s rules rather than relying on marketing labels.